Investment Objective
The fund’s objective is to seek long-term capital appreciation.
Investment Strategy
The fund aimes to provide a dynamic core exposure to U.S. equity and fixed income to help achieve above-average risk-adjusted returns. The Innealta Investment Committee selects exposures in equity sectors, and sub-sectors, as well as fixed-income sectors based on the perceived opportunities of return, risk, and correlation. Our Investment Committee utilizes a proprietary quantitative framework that provides a holistic view of financial markets. The investment objective of the fund is capital appreciation.
Investment Universe
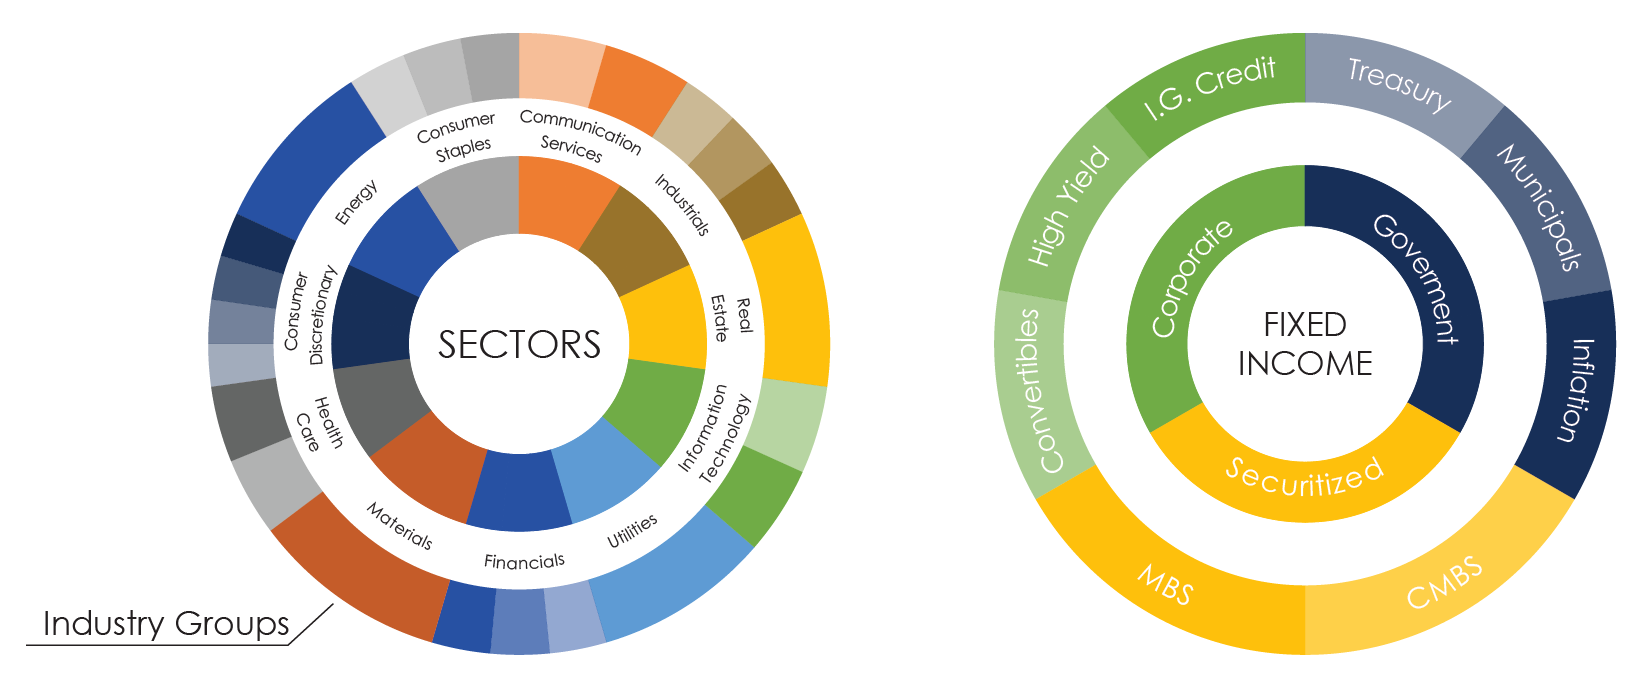
The fund primarily invests in the 11 sectors, 25 industry groups, and 74 industries of the U.S. equity market, as well as in the 3 major sectors of the U.S. fixed income market.
Fund Facts
| Class N | Class I | |
| Ticker | ICSNX | ICSIX |
| CUSIP | 66538A786 | 66538A794 |
| Inception | 12/30/2011 | 12/30/2011 |
| Minimum* | $5,000 | $20,000 |
| Gross Expense Ratio | 1.70% | 1.45% |
| Net Expense Ratio | 1.61% | 1.36% |
The Fund’s investment adviser has agreed to waive its fees and/or absorb expenses of the Dynamic U.S. Opportunity Fund to ensure that Total Annual Fund Operating Expenses (excluding any front-end or contingent deferred sales loads, brokerage fees and commissions, acquired fund fees and expenses, borrowing costs (such as interest and dividend expense on securities sold short), taxes and extraordinary expenses such as litigation) for the Dynamic U.S. Opportunity Fund do not exceed 1.49% and 1.24%, of the Dynamic U.S. Opportunity Fund’s average net assets, for Class N and Class I shares, respectively, through April 30, 2025. The net expense ratio is contractual. This operating expense limitation agreement can be terminated only by, or with the consent of, the Board of Trustees. The Adviser is permitted to receive reimbursement from the Dynamic U.S. Opportunity Fund for fees it waived and Fund expenses it paid, subject to the limitation that: (1) the reimbursement for fees and expenses will be made only if payable within three years from the date the fees and expenses were initially waived or reimbursed; and (2) the reimbursement may not be made if it would cause the expense limitation in effect at the time of the waiver or currently in effect, whichever is lower, to be exceeded.
*Innealta Capital maintains distribution agreements with selected platforms where minimums may be waived for some clients in certain share classes. Please contact us for more details.
Fund Documents
Holdings
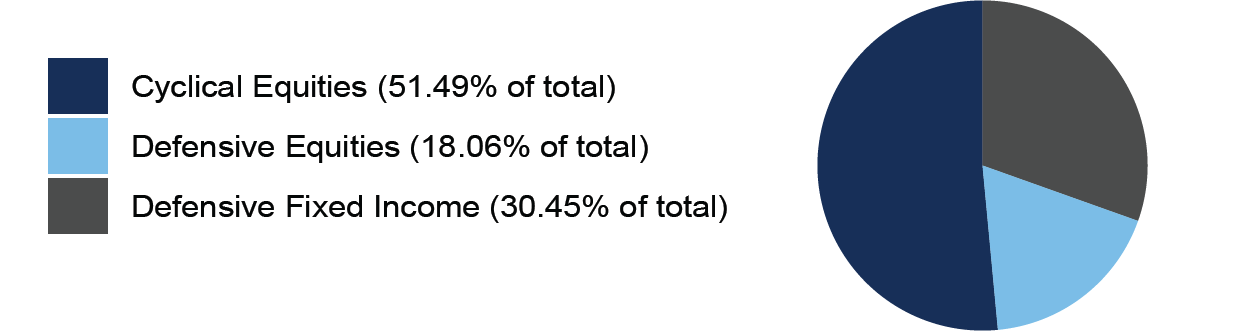
Holdings and allocation data as of March 31, 2021. Fund holdings are subject to change and should not be considered investment advice.
Risk Statistics [1]
| Relative to S&P 500 | Relative to Blend | ||||||||||
|---|---|---|---|---|---|---|---|---|---|---|---|
| Volatility (%) | Average Drawdown (%) | Sharpe Ratio | Alpha (%) | Beta | Correlation | Capture Ratio | Alpha (%) | Beta | Correlation | Capture Ratio | |
| ICSIX | 12.59 | 7.03 | 0.80 | -1.30 | 0.72 | 0.96 | 0.94 | 0.49 | 0.93 | 0.96 | 1.01 |
| S&P 500 [2] | 16.90 | 9.17 | 0.79 | 0.00 | 1.00 | 1.00 | 1.00 | 2.72 | 1.28 | 0.99 | 1.08 |
| Blend [3] | 13.13 | 7.44 | 0.79 | -1.92 | 0.77 | 0.99 | 0.93 | 0.00 | 1.00 | 1.00 | 1.00 |
As of March 31, 2025
Performance
| Return (%) | 3-Month | YTD | 1-Year | 3-Year | 5-Year | 10-Year |
| ICSIX | -0.42 | -0.42 | 2.65 | 6.39 | 12.61 | 8.88 |
| S&P 500 [2] | -4.27 | -4.27 | 8.25 | 9.06 | 18.59 | 12.50 |
| Blend [3] | -2.16 | -2.16 | 7.34 | 6.62 | 12.83 | 9.37 |
As of March 31, 2025
Performance and Risk Statistics as of March 31, 2025. Past performance information provided for the periods prior to March 28, 2018 reflects the performance of the Fund’s prior investment adviser, AFAM Capital, Inc. (“AFAM”), and specifically the Innealta Capital division of AFAM (“Innealta Division”). On March 27, 2018, shareholders approved the new investment advisory agreement with Innealta Capital, LLC which was formed through a reorganization of the Innealta Division. Prior to the reorganization, the Fund was managed by the principals of the Innealta Division, now the principals at Innealta Capital, LLC., who were primarily responsible for the performance results. Innealta Capital, LLC intends to pursue the same investment strategy that was pursued while its principals were employed by AFAM.
Past performance is no guarantee of future results. Current performance may be lower or higher than the data cited above. Investment return and principal value will fluctuate so that shares, when redeemed, may be worth more or less than their original cost. For performance information current to the most recent month-end, please call 855.873.3837. Investments cannot be made in an index. Unmanaged index returns do not reflect any fees, expenses or sales charges.
DISCLOSURES & IMPORTANT INFORMATION
[1] Risk Statistics are supplemental and calculated using monthly data, based on 5-year trailing returns.
[2] S&P 500 TR Index (see below for complete definition).
[3] 70% S&P 500 Index / 30% Bloomberg Barclays U.S., rebalanced quarterly (see below for complete definition).
Innealta Capital, LLC is an Investment Adviser, registered with the Securities & Exchange Commission. For more information, please visit our website: innealtacapital.com.
Investors should carefully consider the investment objectives, risks, charges and expenses of the Innealta Funds. This and other important information about the Funds is contained in the prospectus, which can be obtained by calling 855.873.3837. The prospectus should be read carefully before investing.
The Innealta Funds are distributed by Northern Lights Distributors, LLC a FINRA/SIPC member. Innealta Capital, LLC is not affiliated with Northern Lights Distributors, LLC.
GLOSSARY & RISK CONSIDERATIONS
The S&P 500 Index is an American broad market index based on the market capitalizations of 500 large companies having common stock listed on the NYSE or NASDAQ.
The Bloomberg Barclays US Aggregate Bond Index is representative of the entire universe of taxable fixed-income investments. It includes issues of the U.S. Government and any agency thereof, corporate issues of investment grade quality (Baa/BBB or better), and mortgage-backed securities.
Unmanaged index returns do not reflect any fees, expenses or sales charges, and it is not possible to invest directly in an index.
Alpha is a measure of the difference between a portfolio’s actual returns and its expected performance, given its level of risk as measured by beta. Beta is a measure of volatility, or systematic risk, of a portfolio in comparison to a benchmark. A beta greater than one indicates more volatility, while a beta less than one indicates less volatility than the relevant benchmark. Volatility refers to the standard deviation of (daily/monthly) total returns on an annualized basis using a (252/12) annualization factor. Sharpe Ratio is a measurement of reward per unit of risk as calculated by the average monthly excess return divided by the monthly standard deviation of excess returns. Capture Ratio is the ratio of upside capture to downside capture. Upside capture is the statistical measure of an investment manager’s overall performance in up-markets. The upside capture ratio is used to evaluate how well an investment manager performed relative to an index during periods when that index has risen. Downside capture is a statistical measure of an investment manager’s overall performance in down-markets. Downside capture ratio is used to evaluate how well an investment manager performed relative to an index during periods when that index has exhibited negative performance. Average Drawdown is the average observed loss from a peak to a trough during a specified time period. Correlation measures the strength of the relationship between the relative movements in price of two securities.
Important Risk Information
Mutual Funds involve risk including the possible loss of principal.
The Fund is a ‘fund of funds’ and typically invests in other investment companies and exchange-traded funds (ETFS”). Costs of investing in the Fund are generally higher than direct investments and investors may bear the fees, expenses, and brokerage costs charged by the ETFS. ETFS carry security, market and sector risks, and may not perform as expected which could result in a decline in value. When the Fund invests in ETFs that own fixed income securities, the value of your investment in the Fund will fluctuate with changes in interest rates. The use of leverage and inverse leveraged ETF’s may exaggerate changes in price and return. Accordingly, values may be more volatile and the risk of loss magnified when compared to non- leveraged investments. Other possible risks to the Fund include those related to investment in small and medium-sized companies, general risk, ETF Risk, Equity Securities Risk, Fixed Income Securities Risk, High Yield Risk, Large-cap Securities Risk, Growth Risk, Fund of Funds Risk, Sector Risk, Management Risk, Interest Rate Risk, Leveraged, Inverse and Inverse- Leveraged ETF Risk, Real Estate Investment Risk, Commodity Risk, High Volatility Risk, Derivatives Risk, Futures Risk, Options Risk, Portfolio Turnover Risk, and Cyber Security Risk. Please review the prospectus carefully for additional details.
Shares of the Innealta Capital Funds are currently offered only in the United States to U.S. investors and are not available for sale in any jurisdiction other than the United States. The information on this Web site should not be considered a solicitation to buy or an offer to sell shares of the Innealta Capital Funds in any jurisdiction where it would be unlawful under the securities law of that jurisdiction.
Additional Information
Advisory Services are offered through Innealta Capital, LLC, an Investment Adviser registered with the U.S. Securities and Exchange Commission. Registration does not imply a certain level of skill or training. No federal or state agency or regulatory or self-regulatory authority has approved the information contained in this website, and any representation to the contrary is unlawful. A copy of our Form ADV Part 2 is available below.
Innealta Capital, LLC’s website and its associated links offer news, commentary, and generalized research, not personalized investment advice. All investments involve risk and unless otherwise stated, are not guaranteed. Be sure to consult with a tax professional before implementing any investment strategy.
This website and articles contained herein may contain testimonials from current or former clients, or endorsements from other persons that are supporting or recommending the activities of the Firm. Such individuals may be compensated directly or indirectly by the Firm for the use of their statements. The statements represent the testimony or endorsement by that individual only and may not represent the experience of all counterparties.